Free Options Breakeven Calculator + Charts (All Strategies)
About the Breakeven Calculator
Our calculator shows the breakeven point for any given options strategy at option expiration. It’s important to note that strategies involving short American-style options carry assignment risk, which can occur at any time before option expiration. Fees and commissions are not included in these calculations. Always be aware of liquidity metrics when trading options. Also, the Net Cost/Credit represents the total debit/credit to the account, and does not represent the margin required for a trade, which can be significant for naked short options.
Results are hypothetical and for educational purposes only, and should not be relied upon as investment advice or a guarantee of future outcomes.
Single Option Payoff Profiles
Let’s next look at the individual payoff profiles for all of the strategies listed in our calculator along with trade examples.
Long Call Payoff Profile
.png)
This basic strategy is as bullish as it gets. It profits when the stock rises above the strike price + option premium paid by expiration:
- Max Profit: Unlimited
- Max Loss: Premium paid
- Breakeven at expiration: Strike price + premium paid
Example trade:
- Stock trading at $100
- Buy 105 call for $3.00
- Breakeven: $108
- Max loss: $300
- Max profit: Unlimited
- If stock closes at $115, profit = $70
Long Put Payoff Profile

This basic strategy is the most bearish option strategy out there. It profits when the stock falls below the strike price − the premium paid by expiration:
- Max Profit: Strike price − premium paid (stock goes to zero)
- Max Loss: Premium paid
- Breakeven at expiration: Strike price − premium paid
Example:
- Stock trading at $100
- Buy 95 put for $3.00
- Breakeven: $92
- Max loss: $300
- Max profit: $9,200
- If stock closes at $88, profit = $400
Short Call Payoff Profile

This basic strategy is a bearish to neutral income strategy. It profits when the stock stays at or below the strike price by expiration, allowing the seller to keep the entire premium received:
- Max Profit: Premium received
- Max Loss: Unlimited
- Breakeven at expiration: Strike price + premium received
Example:
- Stock trading at $100
- Sell 105 call for $2.00
- Breakeven: $107
- Max profit: $200
- Max loss: Unlimited
- If stock closes at $112, loss = $500
Short Put Payoff Profile

This basic strategy is a bullish to neutral income strategy. It profits when the stock stays at or above the strike price by expiration, allowing the seller to keep the entire premium received:
- Max Profit: Premium received
- Max Loss: (Strike price − premium received) × 100, if the stock goes to zero
- Breakeven at expiration: Strike price − premium received
Example:
- Stock trading at $100
- Sell 95 put for $2.50
- Breakeven: $92.50
- Max profit: $250
- Max loss: $9,250
- If stock closes at $90, loss = $250
Vertical Spread Payoff Profiles
Vertical spreads are great alternatives to single options because they (1) limit the enormous risk inherent in short options and (2) put less premium at risk than single long calls and puts. That said, it’s essential to understand that this risk mitigation comes at the cost of giving up some upside.
Bull Call Spread Payoff Profile

This basic strategy is moderately bullish. It profits when the stock rises above the long call strike and toward the short call strike by expiration, with both maximum profit and maximum loss defined upfront:
- Max Profit: Difference between strikes − net premium paid
- Max Loss: Net premium paid
- Breakeven at expiration: Long call strike + net premium paid
Example:
- Stock trading at $100
- Buy 100 call for $5.00
- Sell 110 call for $2.00
- Net debit: $3.00
- Breakeven: $103
- Max loss: $300
- Max profit: $700
Bear Call Spread Payoff Profile

This basic strategy is moderately bearish. It profits when the stock stays below the short call strike by expiration, allowing the trader to collect a net premium with clearly defined risk and reward:
- Max Profit: Net premium received
- Max Loss: Difference between strikes − net premium received
- Breakeven at expiration: Short call strike + net premium received
Example:
- Stock trading at $100
- Sell 100 call for $5.00
- Buy 110 call for $2.00
- Net credit: $3.00
- Breakeven: $103
- Max profit: $300
- Max loss: $700
Bull Put Spread Payoff Profile
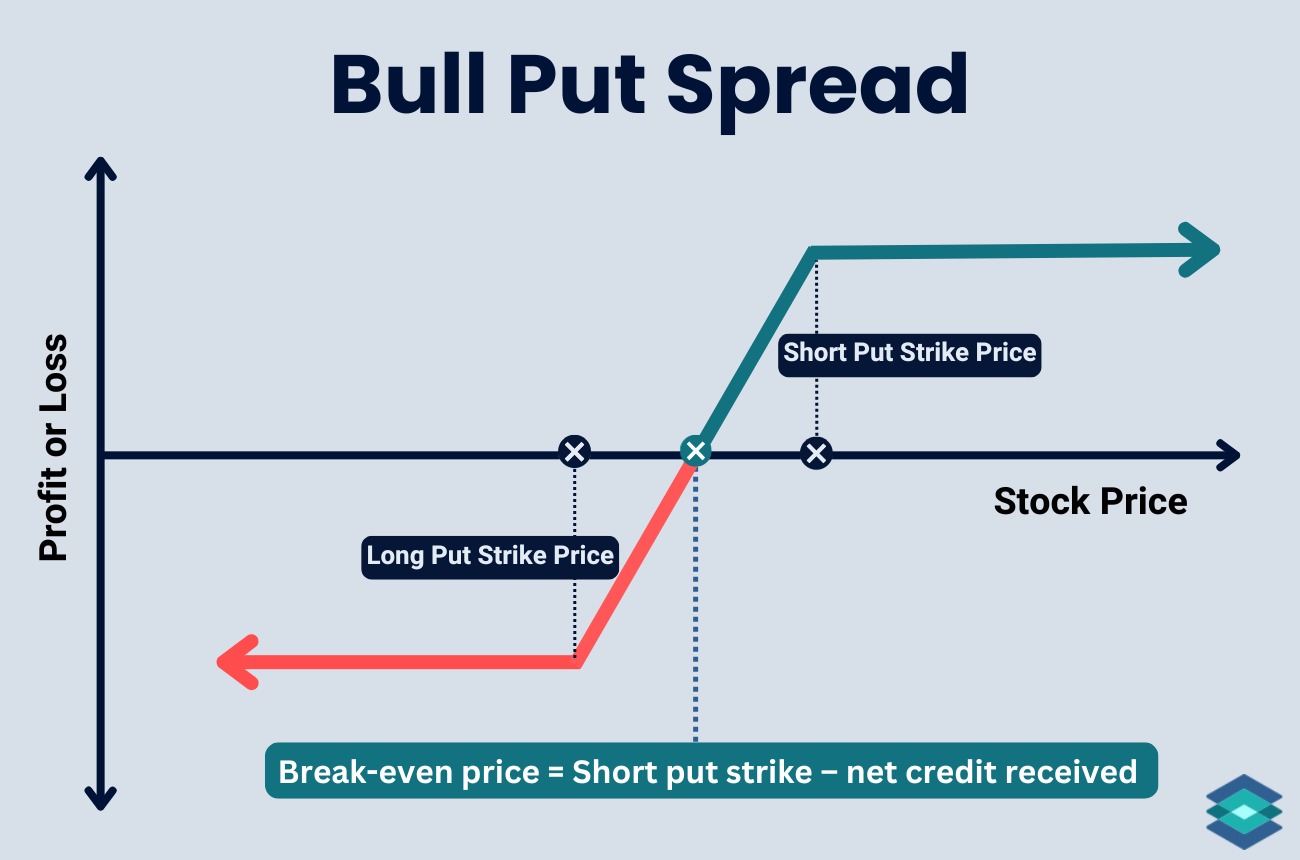
This strategy is moderately bullish. It profits when the stock stays above the short put strike by expiration, allowing the trader to keep the net premium received while defining risk upfront:
- Max Profit: Net premium received
- Max Loss: Difference between strikes − net premium received
- Breakeven at expiration: Short put strike − net premium received
Example:
- Stock trading at $100
- Sell 100 put for $5.00
- Buy 90 put for $2.00
- Net credit: $3.00
- Breakeven: $97
- Max profit: $300
- Max loss: $700
Bear Put Spread Payoff Profile
.png)
This strategy is moderately bearish. It profits when the stock moves lower by expiration, allowing the trader to benefit from downside movement with clearly defined risk and reward using a net debit:
- Max Profit: Difference between strikes − net premium paid
- Max Loss: Net premium paid
- Breakeven at expiration: Long put strike − net premium paid
Example:
- Stock trading at $100
- Buy 100 put for $5.00
- Sell 90 put for $2.00
- Net debit: $3.00
- Breakeven: $97
- Max profit: $700
- Max loss: $300
Straddle & Strangle Payoff Profiles
Straddles and strangles are best used when you expect little movement (short) or extreme volatility (long). Both versions are high-risk, high-reward strategies. However, the short versions are far more popular, particularly around earnings season and ahead of major economic announcements, when implied volatility (IV) tends to spike and, in turn, boosts the premium collected.
Straddles involve buying (long) or selling (short) an at the money call and put. Strangles, on the other hand, use out of the money call and put options. Straddles are best when you expect a significant move (long) or very little movement (short), while strangles are best when you want lower upfront cost (long) or more room for error (short) in exchange for needing a bigger move.
Long Straddle Payoff Profile

This basic strategy is directionally neutral and volatility-driven. It profits when the stock makes a large move higher or lower by expiration, exceeding the total premium paid for both options:
- Max Profit: Unlimited
- Max Loss: Net premium paid
- Breakeven at expiration:
- Upper: Strike price + net premium paid
- Lower: Strike price − net premium paid
Example:
- Stock trading at $100
- Buy 100 call for $4.00
- Buy 100 put for $3.00
- Net debit: $7.00
- Breakevens: $107 and $93
- Max loss: $700
- Max profit: Unlimited
- If stock closes at $115, profit = $800
Short Straddle Payoff Profile

This basic strategy is directionally neutral and income-focused. It profits when the stock stays near the strike price by expiration, allowing the seller to keep the combined premium from both options:
- Max Profit: Net premium received
- Max Loss: Unlimited
- Breakeven at expiration:
- Upper: Strike price + net premium received
- Lower: Strike price − net premium received
Example:
- Stock trading at $100
- Sell 100 call for $4.00
- Sell 100 put for $3.00
- Net credit: $7.00
- Breakevens: $107 and $93
- Max profit: $700
- Max loss: Unlimited
- If stock closes at $112, loss = $500
Long Strangle Payoff Profile

This basic strategy is neutral on direction and designed to benefit from volatility. It profits when the stock makes a large move higher or lower by expiration, exceeding the total premium paid:
- Max Profit: Unlimited
- Max Loss: Net premium paid
- Breakeven at expiration:
- Upper: Call strike + net premium paid
- Lower: Put strike − net premium paid
Example:
- Stock trading at $100
- Buy 105 call for $3.00
- Buy 95 put for $2.00
- Net debit: $5.00
- Breakevens: $110 and $90
- Max loss: $500
- Max profit: Unlimited
- If stock closes at $115, profit = $500
Short Strangle Payoff Profile
.png)
This strategy is neutral and income-focused. It profits when the stock stays between the short put and short call strikes by expiration, allowing the trader to keep the combined premium received:
- Max Profit: Net premium received
- Max Loss: Unlimited
- Breakeven at expiration:
- Upper: Call strike + net premium received
- Lower: Put strike − net premium received
Example:
- Stock trading at $100
- Sell 105 call for $3.00
- Sell 95 put for $2.00
- Net credit: $5.00
- Breakevens: $110 and $90
- Max profit: $500
- Max loss: Unlimited
- If stock closes at $112, loss = $200
Iron Condor Payoff Profiles
Iron condors simply combine a short call spread and a short put spread. Short iron condors are overwhelmingly more popular than long iron condors because of time decay, which is represented by the option Greek theta. Over time, time decay tends to work in the seller’s favor. In practice, most traders prefer selling premium and letting time decay do the work.
Short Iron Condor Payoff Profile

This net credit trade profits when the underlying stock price stays between the short put and short call strikes by expiration, allowing the trader to keep the premium received while risk remains defined on both sides:
- Max Profit: Net premium received
- Max Loss: Difference between strikes − net premium received
- Breakeven at expiration:
- Upper: Short call strike + net premium received
- Lower: Short put strike − net premium received
Example:
- Stock trading at $100
- Sell 95 put for $2.00
- Buy 90 put for $1.00
- Sell 105 call for $2.00
- Buy 110 call for $1.00
- Net credit: $2.00
- Breakevens: $93 and $107
- Max profit: $200
- Max loss: $300
Long Iron Condor Payoff Profile

This long iron condor is the polar opposite trade of the short iron condor. It profits when the underlying stock price makes a move outside the short strikes by expiration, while keeping both maximum risk and reward defined:
- Max Profit: Difference between strikes − net premium paid
- Max Loss: Net premium paid
- Breakeven at expiration:
- Upper: Short call strike + net premium paid
- Lower: Short put strike − net premium paid
Example:
- Stock trading at $100
- Buy 95 put for $2.00
- Sell 100 put for $3.00
- Sell 110 call for $3.00
- Buy 115 call for $2.00
- Net debit: $2.00
- Breakevens: $98 and $112
- Max loss: $200
- Max profit: $300
Butterfly Payoff Profiles
The butterfly options trade can be thought of as combining two vertical spreads with the same expiration, creating a defined-risk, defined-reward strategy centered around a specific price level at expiration. Almost all butterfly trades are net-debit trades (long), so we’re going to focus on that one here.
Butterfly Payoff Profile
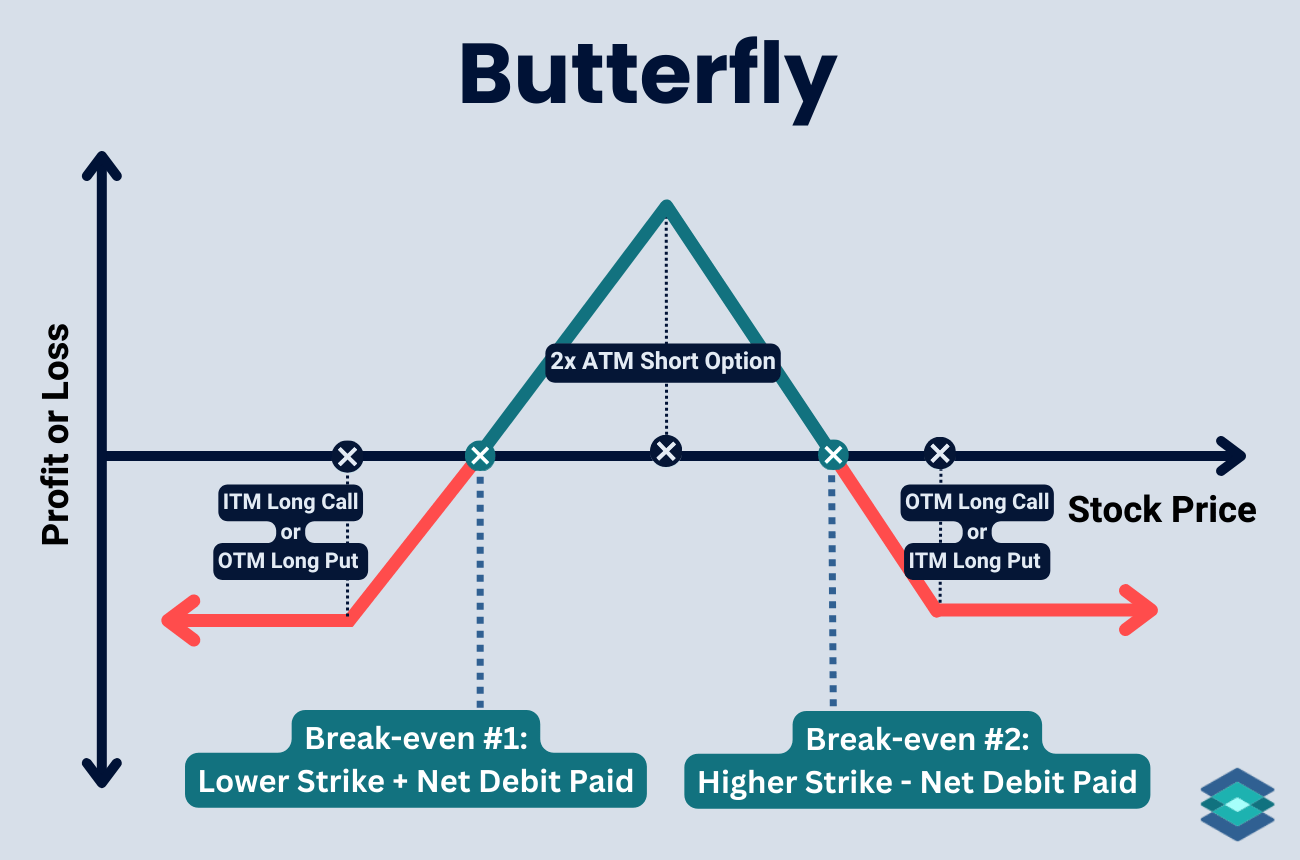
This defined-risk strategy profits when the underlying stock price finishes near the middle strike by expiration.
- Max Profit: Difference between adjacent strikes − net premium paid
- Max Loss: Net premium paid
- Breakeven at expiration:
- Upper: Middle strike + net premium paid
- Lower: Middle strike − net premium paid
Example:
- Stock trading at $100
- Buy 95 call for $3.00
- Sell 100 calls for $4.00 (2 contracts)
- Buy 105 call for $3.00
- Net debit: $2.00
- Breakevens: $98 and $102
- Max profit: $300
- Max loss: $200
Iron Butterfly Payoff Profile
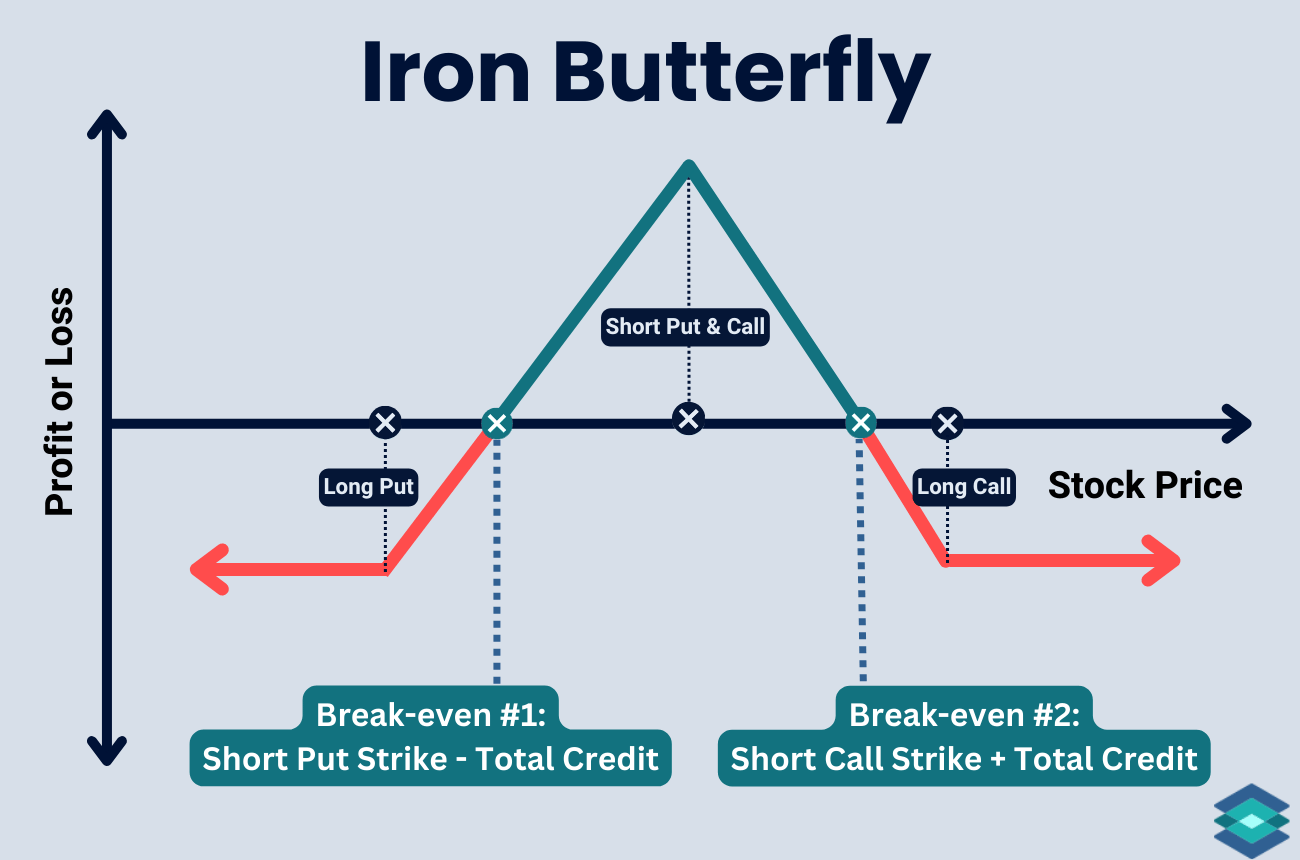
This defined-risk, net credit strategy profits when the underlying stock price stays near the middle strike by expiration, allowing the trader to collect premium from selling both a call and a put at the same strike.
- Max Profit: Net premium received
- Max Loss: Difference between wing width − net premium received
- Breakeven at expiration:
○ Upper: Middle strike + net premium received
○ Lower: Middle strike − net premium received
Example:
- Stock trading at $100
- Sell 100 call for $2.50
- Sell 100 put for $2.50
- Buy 105 call for $1.00
- Buy 95 put for $1.00
- Net credit: $3.00
- Breakevens: $97 and $103
- Max profit: $300
- Max loss: $200
Covered/Collar Payoff Profiles
The covered call is a great way to collect income on a stock if you don’t anticipate a strong upside move by expiration, but it doesn’t do much for downside protection.
The collar options strategy is a covered call with a long put added for downside protection. In a zero-cost collar, you sell the call for roughly the same premium you pay for the put, effectively getting free downside protection while giving up upside beyond the call strike.
Covered Call Payoff Profile

The covered call is mildly bullish to neutral. It profits when the stock stays at or below the call strike by expiration, allowing the trader to collect option premium while owning the underlying shares.
- Max Profit: (Call strike − stock purchase price) + premium received
- Max Loss: Stock purchase price − premium received (stock goes to zero)
- Breakeven at expiration: Stock purchase price − premium received
Example:
- Stock trading at $100
- Buy 100 shares at $100
- Sell 105 call for $3.00
- Breakeven: $97
- Max profit: $800
- If stock closes at $110, profit = $800
Collar Payoff Profile

This strategy uses a short call to pay for some or all of the defensive long put. It protects downside in an existing stock position while capping upside by combining a long put and a short call:
- Max Profit: (Call strike − stock purchase price) + net option credit
- Max Loss: (Stock purchase price − put strike) − net option credit
- Breakeven at expiration: Stock purchase price ± net option credit
Example:
- Stock trading at $100
- Buy 100 shares at $100
- Buy 95 put for $3.00
- Sell 105 call for $3.00
- Net options cost: $0
- Breakeven: $100
- Max profit: $500
- Max loss: $500
🚩All calculations, charts, and examples shown are hypothetical and for educational purposes only, and assume positions are held until option expiration. Results do not account for changes in implied volatility, early exercise, trade management, or real-world execution. Fees, commissions, margin requirements, and regulatory charges are not included and will affect actual results.
Strategies involving short American-style options carry assignment risk, which can occur at any time prior to expiration. Net cost/credit does not represent margin required, which may be significantly higher for certain strategies. Options involve substantial risk and are not suitable for all investors. TradingBlock does not provide investment advice.
FAQ
Add the premium received to the strike price to find the breakeven point on a short call. This is the price at which the short call position results in neither a profit nor a loss.
A long call option gives the buyer the right to purchase a stock at a set price before expiration, typically used when expecting the stock price to rise. A short call option involves selling a call, obligating the seller to sell the stock if exercised, often used to generate income but with unlimited risk if the stock price rises significantly.
To break even on a short put, subtract the premium received from the strike price. This is the price at which the stock needs to stay above for you to avoid a loss.
To calculate the breakeven on a short iron condor:
- For the lower side, add the net credit to the lower short strike.
- For the upper side, subtract the net credit from the higher short strike.
To calculate the breakeven on a long iron condor:
- For the lower side, subtract the net debit from the lower long strike.
- For the upper side, add the net debit to the higher long strike.