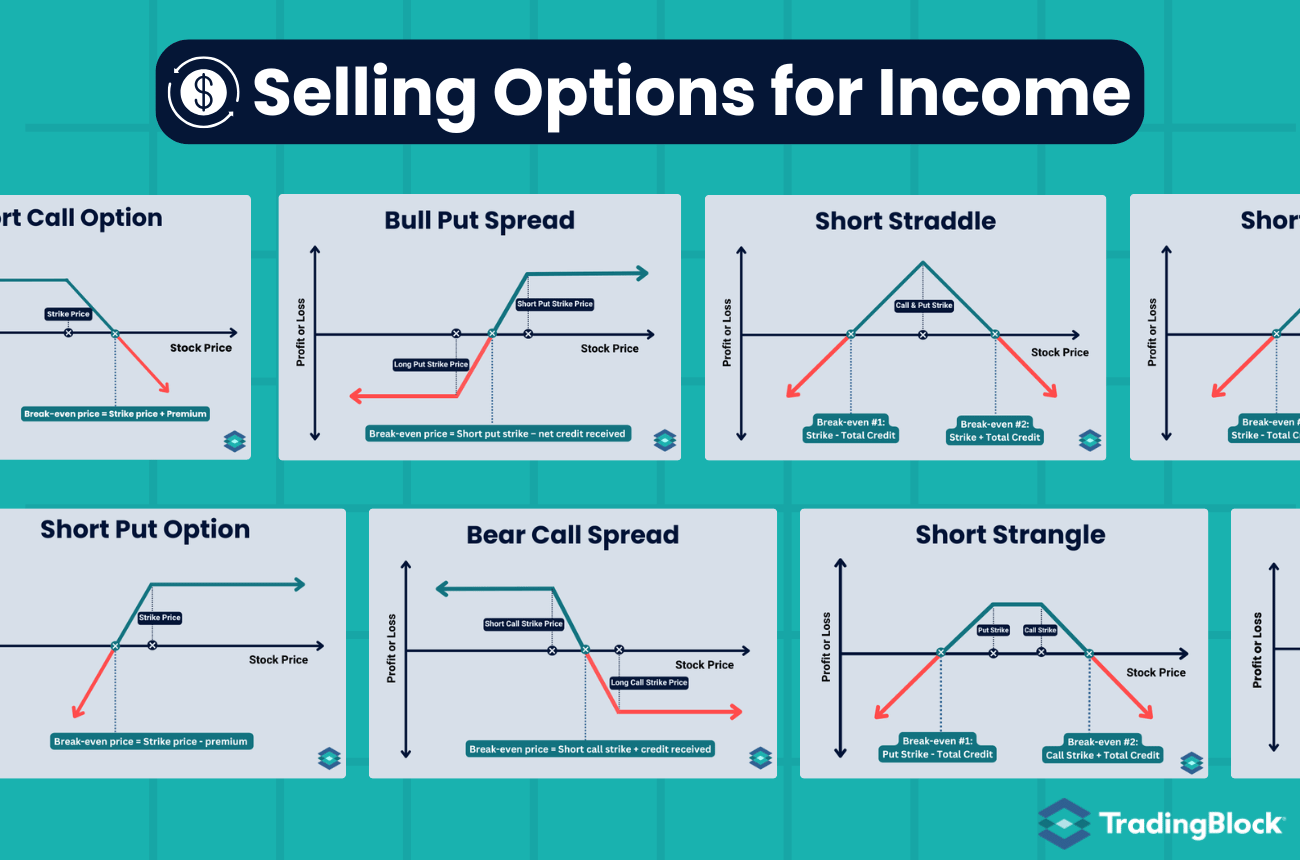
Implied vs Realized vs Historical Volatility: Options 101
In options trading, there are three volatility measures worth knowing: implied volatility, realized volatility, and historical volatility. Implied volatility reflects market uncertainty about future movement. Realized volatility is what actually happened while you held the trade. Historical volatility is that same backward-looking calculation measured over a fixed period, such as the last 30 or 90 days.
.png)
In this article, we're going to explore three different volatility metrics. Spoiler alert: most options traders only care about implied volatility (IV). This is because IV is forward-looking, while realized and historical volatility look backward.
Highlights
- Volatility is measured in three ways. Implied volatility is forward-looking, while realized and historical volatility are backward-looking.
- Implied volatility cannot be calculated from the price data alone. It is obtained by entering an option's market price into a pricing model such as Black-Scholes and solving for the volatility that the price implies.
- Historical volatility serves primarily as a point of reference. It indicates whether current implied volatility is elevated or depressed relative to a stock's typical behavior.
- Realized volatility measures how much an underlying actually moved over a given period
- Option prices reflect expectations of future movement, therefore implied volatility is the measure myself and most traders monitor closest
Volatility Overview
When trading options, volatility is the one input that moves premiums the most, so it pays to know all three measures. Before we get into the nuts and bolts of our three different volatility metrics, let's first look at a brief comparison of them. Please note that options traders almost exclusively focus on implied volatility (IV).
When IV is expensive, many professional traders prefer selling options. When IV is cheap, traders often position themselves to buy options, or go net debit, looking to benefit from a large move in the underlying asset, whether that be a stock, ETF, or index.
What Is Implied Volatility?
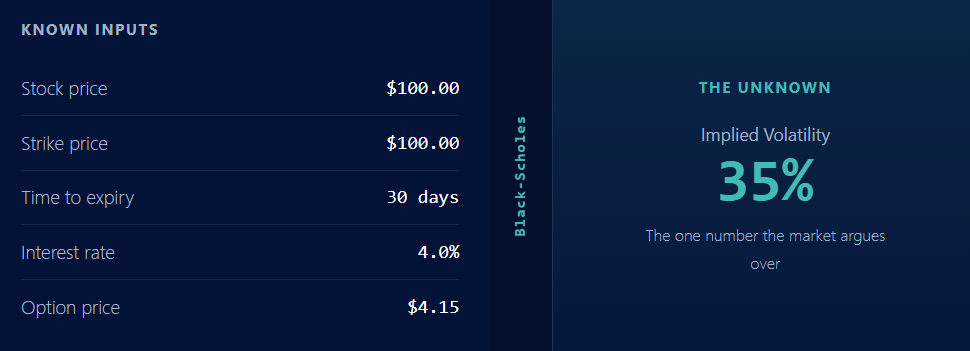
Implied volatility is the market's expectation of how much a stock will move in the future, expressed as an annualized percentage. It reflects market sentiment and market uncertainty about how far the underlying price will move. You don't measure it from price history. You back it out of an option's current market price using a pricing model like Black-Scholes. Take the price the option is trading at, plug it into the model, and solve for the volatility number that makes the math line up.
That makes IV the only truly unknown input in options pricing. Strike price, stock price, time to expiration, and interest rates are all known. Volatility is the variable the market argues over, and it's the one that moves premiums. When IV rises, option premiums inflate. When it falls, they fall, which is the IV crush you hear about around earnings.
What Is Realized (Historical) Volatility?
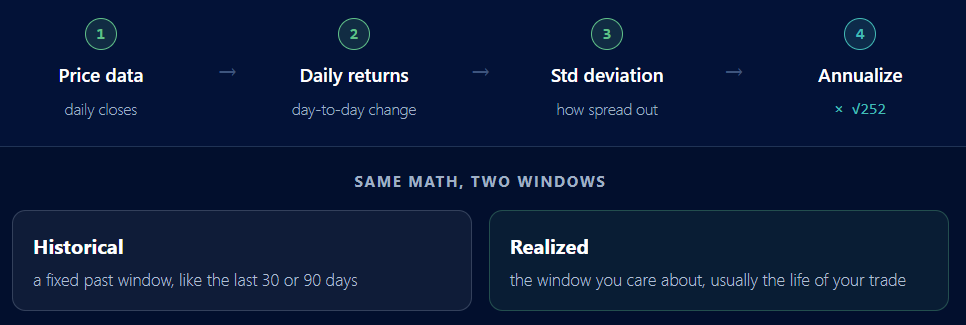
Realized volatility is what the stock actually did. You calculate it straight from past price movements: take the daily returns over a window, find their standard deviation, and annualize it. These underlying price changes are all the math needs. No model, no market opinion, just math on what already happened.
Historical volatility is the exact same calculation. The only difference is the window. People say historical when they mean a fixed, standard lookback like trailing 30 or 90 days, and realized when they mean the specific stretch they care about, often the life of a trade. You'll also hear it called statistical volatility, since it's pure stats run on past returns. Same formula, different slice of time. For most purposes you can treat them as the same thing, and plenty of traders use the words interchangeably.
Where Can I View Implied and Historical Volatility?
You can view both implied and historical volatility on the TradingBlock options chain, as well as some other brokers option chains. Here's a simplified chain. Each expiration shows its own overall IV up top, and within it every contract carries its own option's implied volatility. Notice how the per-contract IV climbs as you move out of the money, forming the volatility smile.
When Should I Use Realized or Historical?
Use historical as a yardstick. On its own it tells you nothing about whether a call option or put option is a good trade. Its job is to give implied volatility context. If a stock's average historical volatility has chopped along at 25% for months and IV suddenly jumps to 60%, the market is likely pricing in a large move like earnings.
Use realized to grade the trade after the fact, or while it's live. If you sold option premium at 60% IV and the stock only realized 30%, you won the volatility bet. If you bought at 60% and it realized 90%, your long vega paid off. The whole game is implied versus realized: the price you pay against what actually shows up.
Implied Volatility and Standard Deviations
Implied volatility is really a one standard deviation forecast of future performance, so it helps to know what that means. Standard deviation measures how far outcomes tend to spread around the average. In a normal distribution, the kind options pricing assumes, the odds fall into clean buckets: about 68% of outcomes land within one standard deviation, 95% within two, and 99.7% within three.
For a stock, that translates straight into expected price ranges. One standard deviation is the move the market is pricing as roughly two-in-three likely. Two standard deviations covers all but the rare 5%, and three standard deviations covers all but the true outliers, the black swan moves. When you hear an option is priced for a one standard deviation move, this is the math behind it.
Implied Volatility Example
Say ABC is trading at $100 and its options are pricing 25% implied volatility. That 25% is annualized, so it translates straight into an expected range: one standard deviation is 25% of $100, or about $25. The market is effectively saying ABC has roughly a 68% chance of finishing the year between $75 and $125. The bell curve below shows where that comes from...
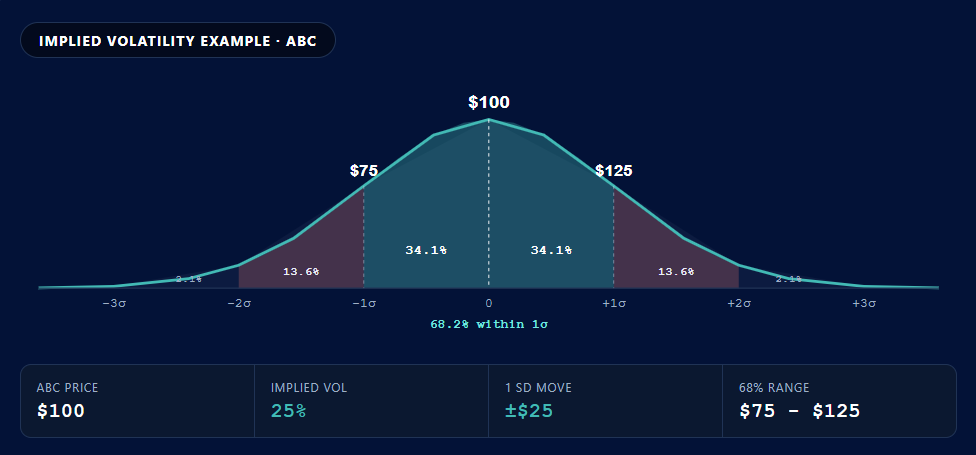
About 34% of the probability sits on each side of $100 inside one standard deviation, the $75 to $125 band. Push out to two standard deviations, $50 to $150, and you capture about 95% of the expected outcomes. The further a strike sits from the money, the lower the odds the stock reaches it, which is why far out-of-the-money options are cheap. The market doesn't price both wings equally either, and that lopsidedness is the volatility skew.
This is the practical read most traders care about. You are not predicting direction, you are sizing the range. A premium seller might lean on that 16% tail above $125 or below $75, while a buyer is paying for the chance the stock breaks out of the band entirely.
Implied Volatility Formula
There's no clean formula that spits out implied volatility directly. You can't isolate it on one side of the equation. Instead you start from the Black-Scholes option price and solve for the volatility that reproduces the option's market price, usually by iterating until the model matches. Here is the equation you would use for call options.
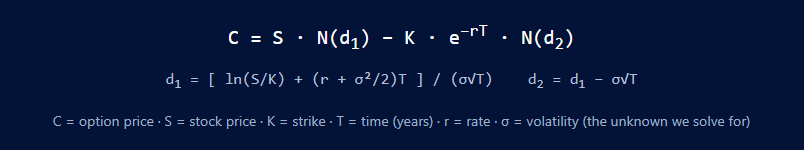
In plain terms: the market hands you C, the price the option trades at. Everything else except σ is known. So you guess a volatility, price the option, compare to the market, and adjust, over and over, until they match. That recovered σ is the implied volatility.
Realized Volatility Formula
Realized volatility is the honest one. It's a direct calculation, no iterating, no model. Take the daily log returns, find their standard deviation, and annualize by multiplying by the square root of the number of trading days in a year (252).
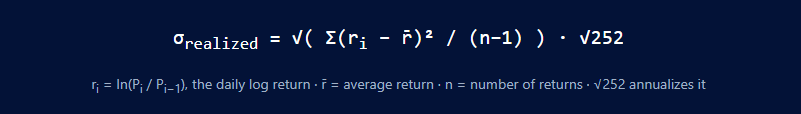
In plain terms: measure how much the stock bounced around each day, average out the spread, and scale it to a yearly figure so it's comparable to the implied number on your chain.
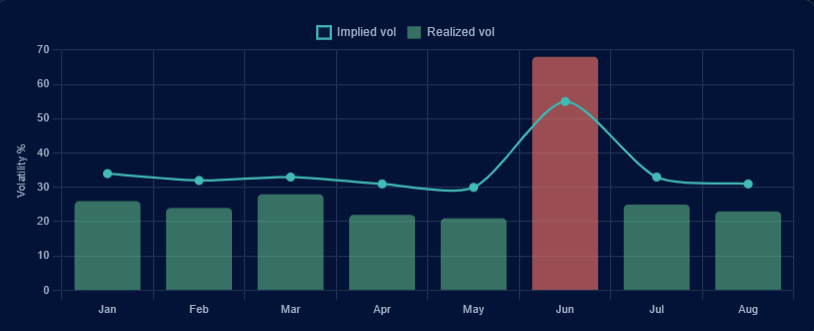
Putting It Together: Implied vs Realized
Here's the relationship that actually decides P&L. The line is implied volatility, the market's forward guess. The bars are the realized volatility that followed. When implied sits above realized, sellers win. When realized spikes above implied, buyers win. The gap is the trade.
FAQ
Implied volatility (IV) is the market's expectation of how much a stock may move in the future, derived from option prices. It forecasts the size of the move, not the direction.
Implied volatility is what the market expects to happen. Realized volatility is what actually happened. Option buyers want realized volatility to exceed implied volatility, while sellers want the opposite.
Mostly. Both measure past price movement using the same math. Historical volatility usually refers to a fixed lookback period, while realized volatility often refers to a specific period, such as the life of a trade.
Neither. High IV means expensive options, which generally benefits sellers. Low IV means cheaper options, which can favor buyers.
Implied volatility is backed out of an option's market price using a pricing model like Black-Scholes. It's the volatility input that makes the model match the option's actual price.
IV Rank and IV Percentile are both tools traders use to judge whether implied volatility is high or low. IV Rank compares today’s IV to its 1-year range, while IV Percentile shows how often IV has been lower over the past year.
Here is how you calculate IV Rank: (Current IV – 1-year low) ÷ (1-year high – 1-year low) × 100
Future volatility is the actual volatility a stock will realize over a period that has not happened yet. Since it cannot be known in advance, traders use implied volatility as the market's best estimate of future volatility.
Implied volatility is forward-looking. It's what the market expects, backed out of an option's price. Historical volatility is backward-looking. It's what the stock actually did over a past window.


.png)
.png)